The following code snippets were run for ANOVA:
PROC IMPORT DATAFILE=’/home/dd16er0/my_courses/nesarc_pds.csv’PROC IMPORT DATAFILE=’/home/dd16er0/my_courses/nesarc_pds.csv’ DBMS=CSV OUT=crsera.nesarc; GETNAMES=YES;RUN;
DATA new; set crsera.nesarc;
LABEL TAB12MDX=”Dependence” CHECK321=”Smoked12″ S3AQ3B1=”UsualFreq” S3AQ3C1=”UsualQuant”;
IF S3AQ3B1=9 THEN S3AQ3B1=.;IF S3AQ3C1=99 THEN S3AQ3C1=.;
IF S3AQ3B1=1 THEN USFREQMO=30;ELSE IF S3AQ3B1=2 THEN USFREQMO=22;ELSE IF S3AQ3B1=3 THEN USFREQMO=14;ELSE IF S3AQ3B1=4 THEN USFREQMO=5;ELSE IF S3AQ3B1=5 THEN USFREQMO=2.5;ELSE IF S3AQ3B1=6 THEN USFREQMO=1;
NUMCIGMO_EST=USFREQMO*S3AQ3C1;
PACKSPERMONTH=NUMCIGMO_EST/20;
IF PACKSPERMONTH LE 5 THEN PACKCATEGORY=3;ELSE IF PACKSPERMONTH LE 10 THEN PACKCATEGORY=7;ELSE IF PACKSPERMONTH LE 20 THEN PACKCATEGORY=15;ELSE IF PACKSPERMONTH LE 30 THEN PACKCATEGORY=25;ELSE IF PACKSPERMONTH GT 30 THEN PACKCATEGORY=58;
IF CHECK321=1;IF AGE LE 25;
PROC SORT; by IDNUM;
PROC ANOVA; CLASS CONSUMER;MODEL NUMCIGMO_EST=CONSUMER;MEANS CONSUMER;
PROC ANOVA; CLASS CONSUMER;MODEL NUMCIGMO_EST=CONSUMER;MEANS CONSUMER/DUNCAN;
RUN;
The detailed result:
Model Interpretation for ANOVA:
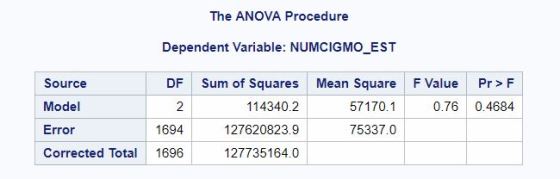
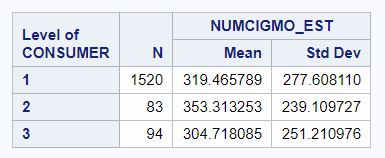
When examining the association between current number of cigarettes smoked (quantitative response) and alcohol consumption status (categorical explanatory), an Analysis of Variance (ANOVA) revealed that among daily, young adult smokers (my sample), there is no association between their current status of drinking (current drinker [1], ex-drinker [2], lifetime abstainer [3]) and number of cigarettes smoked as F = 0.76 having P = 0.4684> 0.05. This implies that I cannot reject my null hypothesis which is there is no association between alcohol consumption status and smoking quantity. Note that the mean numbers of smoking among current drinkers, ex-drinkers and lifetime abstainers are 319.46 (SD 277.61), 353.31 (SD 239.11) and 304.71 (304.71) respectively.
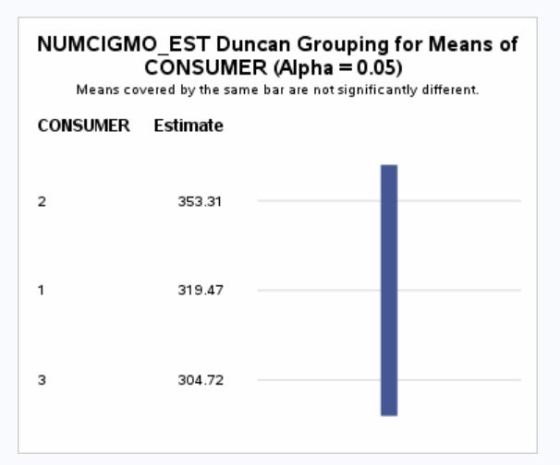
Model Interpretation for post hoc ANOVA results:
The post hoc comparison (Duncan Grouping) corroborates the non-significant result found from ANOVA run above.